Classification
 cridet: medium.com
In a classification problem the output is a set of predefined classes (or labels or categories). A classifier is an algorithm (i.e., a set of rules) that tries to predict the correct label (or class) to a given input. In machine learning, the classifier uses data (or training data) to optimize it prediction process.
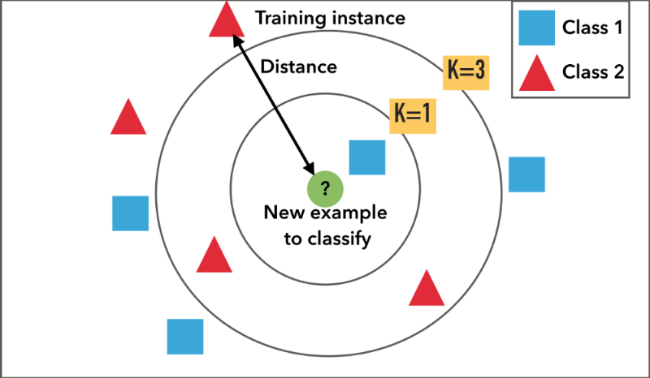
The 1-nearest neighbor classifier
This algorithm computes distances between an input data point and the data points of a training dataset. Then, it yields the label associated with the training data point that is closest to the input. So, to use this algorithm, we need to calculate distances between vectors (or data points), and the Euclidean distance function is a natural way for doing so. For two vectors \( x, y \in \mathbb{R}^d \), their Euclidean distance is defined as $$\|x - y\| = \sqrt{\sum_{i=1}^d (x_i - y_i)^2}.$$ For our use case, we can omit the square root to simplify the computation.
Implementation
1) Loading data:- We will load the scikit-learn's MNIST hand-written dataset. The dataset contains \( 8\times8 \)
grayscale images of hand written digits. We can access these images with the images attribute and
the labels with the target attribute.
from sklearn.datasets import load_digits
# loading the digits dataset
digits = load_digits() # get the number of images in the datasets
num_samples = len(digits.images)
# reshape the matrix from (num_samples x 8 x 8) to (num_samples x 64)
data = digits.images.reshape((num_samples, -1))train_test_split method form sklearn.
from sklearn.model_selection import train_test_split
X_train, X_test, y_train, y_test = train_test_split(
data, digits.target, test_size=.25, shuffle=False)import numpy as np
def euclidean_dist(x, y):
return np.sum( np.square( x - y) )def find_NN(x, dataset):
distances = [euclidean_dist(x, y) for y in dataset]
return np.argmin(distances)def classify(x, dataset):
idx = find_NN(x, dataset)
return y_train[idx] Test
Let us select a test point and pass it to our classifier
sample_test = 210
test_digit = X_test[sample_test]
test_label = y_test[sample_test]
pred = classify(test_digit, X_train)
print(f"Predicted digit {pred}, Correct digit {test_label}" )

import matplotlib.pyplot as plt
plt.imshow(test_digit.reshape((8,8)), cmap=plt.cm.gray)
plt.show()
Predicted digit 2, Correct digit 2 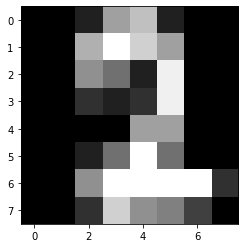
Let us pass all the test set to our classifier and find out the error percentage
errors  = [ y_test[idx] != classify(X_test[idx], X_train) \
    for idx in np.arange(len(y_test)) ]
print(f'The error percentage is {np.sum(errors) / len(y_test) * 100:.2f}%')The error percentage is 3.78%
Access the Code
You can access the code in the associated Google Colab page . There you will also
find the object oriented Implementation.